


Elementary Algebra Review
GRAPHING
Graphing Linear Equations
The graph of a linear equation in two variables is the set of all ordered pairs
which make the equation
true. These ordered pairs can be obtained by arbitrarily assigning a value to
one member of the ordered
pair (usually the X) and then calculating the corresponding other member (Y). To
graph a linear equation
find at least three solution pairs in this manner. Plot these points on the
coordinate plane. Finally draw
the straight line which passes through these three points.
| Example: | Graph X + Y = 5 | |
| Choose X = 0, 0 + Y = 5, Y = 5 | (0, 5) is a point | |
| Choose X = 2, 2 + Y = 5, Y = 3 | (2, 3) is a point | |
| Choose X = 5, 5 + Y = 5, Y = 0 | (5, 0) is a point |
The plotting of these points may not be exact due to software limitations.
Graphing Linear Inequalities
The graph of a linear inequality is a region of the coordinate plane called a
half-plane. The graph of the
related linear equality forms the boundary line between the half-plane that is
the solution set and the halfplane
that is not. To form the graph, first plot the related equation. This boundary
line is dashed if the
inequality is a strict inequality (<or>) and solid if the inequality contains ≤
or ≥. The solution set is then
determined by selecting any point not on the boundary and testing this point for
truthfulness. (See next
page)
Example: Graph 3X – 4Y < 12
 The plotting of these points may not be exact due to software limitations. |
1. Graph the related line. The line is plotted dashed. 2. Choose the point (0, 0) and check these values in the original inequality. 3(0) – 4(0) < 12 0 < 12. Note: If (0, 0) is on the boundary, select another point such as (0, 1) or (1, 0) not on the boundary. 3. Shade the half-plane containing (0, 0) Note: If the point tested produces a false statement, shade the half-plane that does not contain the tested point. |
Slope of a Line
Slope is a measure of the steepness of a line. Slope is defined by the formula:
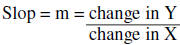
Slope is calculated using the formula:

When (X1, Y1) are the coordinates
from point 1 and (X2, Y2) are the coordinates from the
point 2. It
should be noted that it does not matter in which order the two points are
considered. The labeling of point
1 and point 2 is arbitrary, as long as both coordinates represent the point
labeled as point 1 are used as X1
and Y1 and both coordinates representing the point labeled as point 2
are used as X2 and Y2. Furthermore
it does not matter which two points on any given line are used to determine the
slope, the slope remains
the same regardless of the point chosen to compute it.
Example: Find the slope of the line though (-2, -3) and (2, 5)
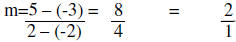
Thus the slope is 2.
Parallel lines are two distinct lines which do not intersect and have the same
slope.
Perpendicular lines are two distinct lines which intersect at right angles. In
perpendicular lines, the
product of the slopes of the line is -I. The slopes of perpendicular lines are
opposite reciprocals.
Writing Equations of Lines
The slope intercept form of the line is used in writing the equation of a line.
First the slope is determined
from the given information. The y- intercept is then determined by using this
slope and any given point.
From this information the equation of the line is written.
|
Example:
|
Write the equation of the line through (5, 1) and (-3, -7) | |
 |
Determine the slope | |
| Y = mX + b | Slope intercept form of line | |
| 1 = 1(5) + b | Substitute m = I and point (5, 1) | |
| -4 = b | Solve for y-intercept | |
| Y=X – 4 | Equation of a line | |
| Example: | Write the equation of a line parallel to Y = 6X – 1 and through the point (-1, -2) | |
| M = 6 | Read slope from line | |
| Y = mX + b | Slope intercept form of the line | |
| -2 = 6(-1) + b | Substitute m = 6 and point (-1, -2) | |
| 4 = b | Solve for b | |
| Y = 6X + 4 | Equation of the line | |
Exercises
1. Graph 2X – 3Y = 6
2. Graph Y – X < 3
3. Find the slope of the line that passes through (6, 0) and (-5, 4).
4. Determine whether  and X + 9 = 2Y are
parallel, perpendicular, collinear, or intersecting.
and X + 9 = 2Y are
parallel, perpendicular, collinear, or intersecting.
5. Find the equation of the line that contains the point (2, 4) and is
perpendicular to Y = 2/3X + 2.
6. The cost for a buffet special at the Skylite Diner is a “plate fee” plus an
amount per ounce. The cashier
writes the number of ounces and price owed as an ordered pair. She writes (10,
4.85) and (22, 8.33) for
two orders. Write the equation of a line; then determine the “plate fee” and
cost per ounce.
7. The cost of producing plastic tubs is linearly related to the number of tubs
produced. The production
cost is $178 for 28 tubs in March and $193 for 33 tubs in April. How much is the
variable cost of
production per tub? How much is the overheard (cost of operation even if no tubs
are produced)?
8. A manufacturer determines that the relationship between profit earned P, and
the number of items sold
X, is linear. Suppose profit is $1500 for 45 items and $2500 on 65 items. What
would be the expected
profit on 100 items?
9. A three story building is on fire. When the fire fighters arrive at the
scene, it is determined (for safety
purposes) that all fire fighters must be at least 70 feet from the fire. The
maximum horizontal distance of a
stream of water is determined by the equation S = .05N + 40D – 4, where S is
maximum horizontal
distance, N is nozzle pressure in lb/sq.in. and D is diameter of the hose nozzle
in inches. If the fire engine
can only generate 48 lbs/sq.in. of nozzle pressure, what is the minimum nozzle
diameter that will enable a
stream of water to reach the edge of the fire?