


Graphs of Equations and Functions
1 1.1 Functions and Mathematical Modeling p.2
Functions
• A real-valued function f defined on a set D of real numbers is a rule that
assigns to
each number x in D exactly one real number, denoted f(x).
• The set D of all numbers for which f(x) is defined is called the domain.
• The number f(x) is called the value of the function f at the point x.
• The set of all values y = f(x) is called the range of f.
• When a function f is described by writing a formula y = f(x), we call x the
inde-
pendent variable and y the dependent variables because the value of y depends
on the choice of x.
Idea. A function is discrete if it only takes on certain isolated values. A
function is contin-
uous if it can take on any numbers.
Domains and Intervals
• The domain of the function f is the set of all real numbers x for which the
expression
f(x) makes sense and produces a real number y.
Often, a domain is R, or all real numbers. There are two restrictions that we
know. you
can not take the square root of a negative number and you can not divide by
zero.
• A closed interval contains both its endpoints x = a and x = b and is written
[a, b].
• A open interval contains neither of its endpoints, written (a, b).
• A half open interval contains exactly one of its endpoints, like (a, b] or [a,
b).
• An unbounded interval has positive or negative infinity as an `endpoint',
written

2 1.2 Graphs of Equations and Functions p.12
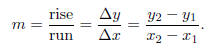
• The slope-intercept equation is y = mx + b for the straight line with slope
m =
 angle of inclination
 and y-intercept b.
• We also define the slope m as "rise over run."
• The point-slope equation for a line is y - y0 = m(x - x0), with slope m
passing
through the point (x0, y0).
Horizontal lines have slope zero.
Vertical lines have no defined slope.
Parallel lines have the same slope.
Graphs of More General Equations
• The graph of an equation in two variables x and y is the set of all points
(x, y) in the
plane that satisfy the equation.
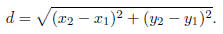
• The Pythagorean theorem implies the distance formula
• x2 + y2 = r2 is the equation for a circle of radius r centered at (0, 0).
• More generally, (x-h)2+(y-k)2 = r2 is the equation for a circle of radius r
centered
at (h, k).
Translates of Graphs
Translation Principle. When the graph of an equation is translated h units to
the right
and k units up, the equation of the translated curve is obtained from the
original equation
by replacing x with x - h and y with y - k.
Example of completing the square to find the center of a circle, page 14.
Graphs of Functions
• The graph of a function is a special case of the graph of an equation.
• The graph of the function f is the graph of the equation y = f(x), so the set
of all
points in the plane (x, f(x)).
The Vertical Line Test. Each vertical line through a point in the domain of a
function
meets its graph in exactly one point.
• The values of x where the value of f(x) makes a jump are called points of
discon-
tinuity.
Parabolas
• The graph of a quadratic function of the form f(x) = ax2
+ bx + c for a ≠ 0,
is a
parabola.
• To draw, make a table of a few points and sketch.
• The size of the coefficient a determines the width of the parabola.
• The sign on a determines if the parabola opens up or down.
• Any quadratic equation can be manipulated to be of the form y - k = a(x - h)2
by
completing the square. It is now easy to see the vertex of the parabola is at
(h, k).
Applications of Quadratic Functions
If we plot the equations, we can find the vertex of the parabola, which
corresponds to a
maximum or minimum.
Graphic, Numeric and Symbolic Viewpoints
Idea. We can look at the same information graphically (in the picture of a graph
or the
sketch of a curve), numerically (like in a table of data measurements
collected), or symboli-
cally (like an equation, which gives a rule for finding any data points and
plotting them on
a graph).