Graphing Calculator Guide - Regression
Not all sets of data points can be modeled
well by linear functions. For some data, we
want to find the best quadratic model or polynomial
model or exponential model. The
process is not linear regression, but quadratic
regression or polynomial regression or exponential
regression.
We can have the calculator do these other
types of regression in the same manner as
linear regression. For example, suppose we
want to model the following data with the
quadratic function of best fit.

We still enter the data in STAT Edit… and
then press STAT and choose the CALC submenu.
But now choose 5:QuadReg for quadratic
regression. Then press VARS; move
RIGHT to select Y-VARS; hit ENTER for
Function; and then highlight whichever Y=
you want to put the equation into and press
ENTER.

And so our quadratic function is

[It works similarly for other types of regression. Just
choose the other type instead of LinReg or QuadReg.]
1. ENTERING POINTS OF DATA
Suppose we want to plot the data
shown in the table. We will make
what’s called a scatterplot:
1. Press STAT.
2. Hit ENTER to choose 1:Edit.
3. This is where you enter points. L1 is like the x-column in our table; L2 is
the y-column. We don’t need L3.

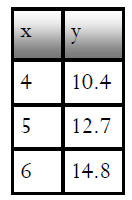
- To clear an entire column of data, use the arrows to highlight the name of the column (L1, for example) and type CLEAR and then ENTER. Do not hit DEL, as this will delete the entire column and its name!
- If you need to remove just a single number, you can use the arrows to highlight it and then hit DEL.
Enter your data as shown.
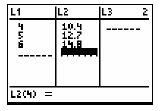
4. Now, we need to turn on the statistical graph. Hit yellow button 2nd and then Y= to access STAT PLOT.
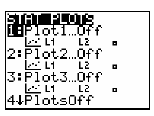
5. Hit ENTER to choose 1:Plot1…
6. Now make sure that On is highlighted and the rest of the choices are as below. If they are not, use your arrows to move to the appropriate choice and type ENTER.
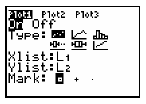
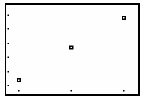
7. Hit ZOOM and choose option 9: ZoomStat (you may need to use the arrows to scroll down to find it—or just do Zoom and then 9 for short). And there we have it!
2. LINEAR REGRESSION
Statisticians have developed a particular method, called
the
"method of least squares," which is used to find a “line of best
fit” for a set of data that shows a linear trend. The algorithm
seeks to find the line that minimizes the total error. These
algorithms are programmed into the graphing calculator and
are available for student use. The technical name of the process
for finding the line of best fit is linear regression.
1. Press STAT.
2. Press the RIGHT ARROW button to move to the CALC submenu.
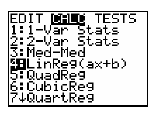
3. Select 4:LinReg(ax+b) by moving to
highlight it and pressing ENTER (or just
typing 4). Do NOT hit ENTER again...
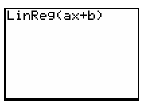
4. To make things easier, we want to automatically put the
equation of the line of
best fit into Y= so it will be graphed on top of the data. To
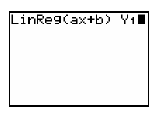
do this, press VARS; move RIGHT to select Y-VARS; hit
ENTER for Function; and then highlight whichever Y= you
want to put the equation into and press ENTER.

Now you get the following screen:
Press ENTER to run the command.
Your calculator returns the following screen:

What this tells you is that the line of best fit is
given by a linear equation y = ax + b, but that a
= 2.2 and b = 1.633333333. In other words, the
equation is
Y = 2.2x + 1.633333333
Notice that, if you press Y= now, the equation
has been automatically put in!

Finally, hit GRAPH and you can see the line
graphed along with the points of data!

IMPORTANT NOTE: Sometimes, after using
the STATPlot in one problem, it interferes with
regular Y= graphing in another problem, causing
an error. If this happens, try turning the STATPlot
off when you don’t need it for a problem.
To do this:
1. Press 2nd and Y= to access STATPlot.
2. Press 4 to select PlotsOff and then hit ENTER.


