Investigating Liner Equations Using Graphing Calculator
Activity 2
Graphing Lines of the Form y = mx + b
Objective: In this lesson you will see how the constant b affects the line graph.
1. Use a graphing calculator to graph each equation and complete the following
chart. An example is solved for you.
| Equation | Value of m |
Value of b |
Sketch | y-intercept | x-intercept |
| y = x – 3 | 1 | -3 |
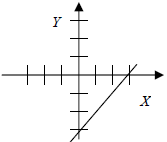 |
(0,-3) | (3,0) |
| y = x + 4 | |||||
| y = x + 5.5 | |||||
| y = 2x – 5 | |||||
| y = 2x + 4.8 | |||||
| y = 3x – 2 | |||||
| y = -3x + 7 | |||||
| y = -3x |
2. Use the results to answer the following questions.
a. If b has a positive value, then the y-intercept is (above, below) the x-axis.
Circle one answer.
b. If b has a negative value, then the y-intercept is (above, below) the x-axis.
Circle one answer.
c. What is the y-intercept of the equation y = 2x + 4? _________________________
d. What is the y-intercept of the equation y = mx + b? ________________________
3. Answer the following questions about the first three entries in Exercise 1.
a. What is the same about all three graphs? ________________________________
b. These lines never intersect so we say they are ___________________________
c. What is the relationship between b and the x-intercept in these equations?
____________________________________________________________________
d. What are the x- and y-intercepts of y = x – 5? ____________________________
e. How does changing the value of b affect graphs of the form y = x + b?
_________
____________________________________________________________________
4. Describe and compare the graphs of y = 3x – 1 and y = 3x + 2. (Use a graphing
calculator to help you see the graphs.) __________________________________
____________________________________________________________________
____________________________________________________________________
5. Write an equation whose graph is a horizontal line. ________________________
6. Write an equation whose graph is a horizontal line through (0, 2.5). ____________
7. Write an equation whose graph is a line parallel to and between the graphs of
y = 3x + 2 and y = 3x + 4.5 ____________________________________________
8. Write and equation whose graph is a line parallel to the graph of y = -3x +
1, but with
y-intercept (0,-5). ____________________________________________________
Activity 3
Graphing Lines
Objective: In this lesson you will see how to graph equations that are not in
the
slope-intercept form y = mx + b.
Solve each equation for y then write the equation in slope-intercept form. Find
the
slope, and x- and y-intercepts, and graph the line. An example is solved.
| Equation | Equation in slope-intercept form |
sketch |
| 2x + y – 3 = 0 Solve for y: 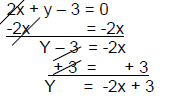 |
Y = -2x + 3 Slope = -2 y-intercept =(0,3) x-intercept = (1.5,0) |
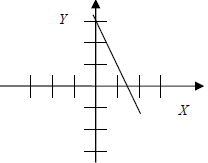 |
| Y + 3x = 4 | ||
| Y – 3.5 = 2x | ||
| 5x – y = 15 | ||
| -1x = 4 + y | ||
| 2y + 5x – 7 = 0 | ||
| Challenge: Write your own problem below. Follow the directions above to solve and graph the line. |
||
Activity 4
Find That Equation
Objective: In this lesson you will see how to find the equation of a line by
looking
at its graph.
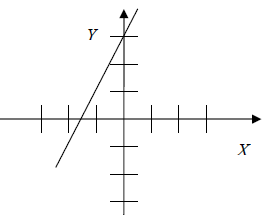
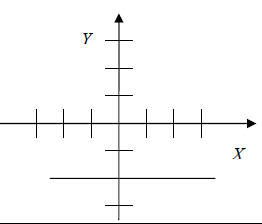
Examine each graph below and predict its equation. Then use the graphing
calculator
to test your prediction. The first problem is solved for you.
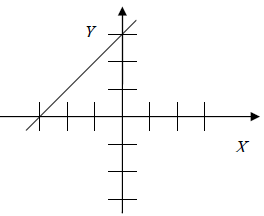 |
Reasoning: The y-intercept is (0, 3). ----->" b = 3 The slope is positive and equals 1. ---->" m = 1 The slope-intercept form ----->" y = mx + b Substitute the values of m and b. y = 1x +3 Equation: y = x + 3 |
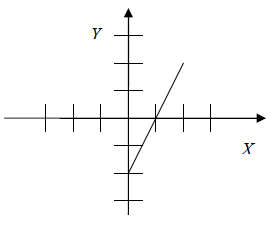 |
|
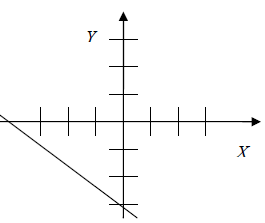 |
|
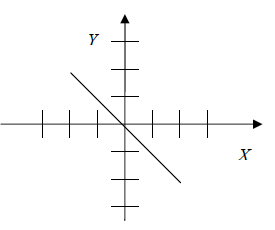 |
|
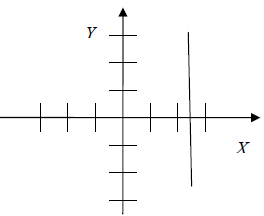 |
|
 |
|
 |


